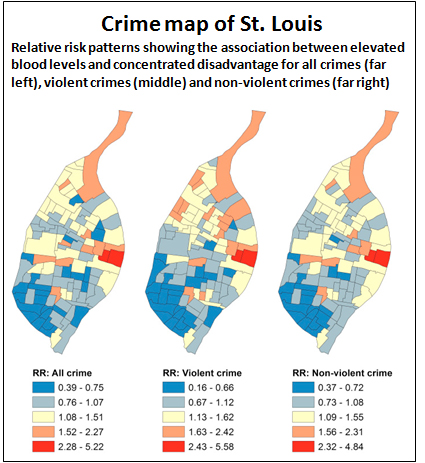
 Several months ago I wrote about a new study that compared lead poisoning and crime rates at the census tract level in St. Louis. This is one of the most detailed, neighborhood-level studies I’ve seen, and the authors reached a simple conclusion: “We uncovered a relatively strong effect of lead on behavior, especially violent behavior.”
Today, Andrew Gelman took a look at this study. My first response was “Uh oh.” Gelman tends to specialize in debunking bad statistics, so this might not go well. But in the end, Gelman was convinced:
I had a bit of a skeptical reaction—not about the effects of lead, I have no idea about that—but on the statistics….So I contacted the authors of the paper and one of them, Erik Nelson, did some analyses for me.
First he ran the basic regression—no Poisson, no spatial tricks, just regression of log crime rate on lead exposure and index of social/economic disadvantage…. Then I asked for a scatterplot: log crime rate vs. lead exposure, indicating census tracts with three colors tied to the terciles of disadvantage….He also fit a separate regression line for each tercile of disadvantage. As you can see, the relation between lead and crime is strong, especially for census tracts with less disadvantage.
….In summary: the data are what they are. The correlation seems real, not just an artifact of a particular regression specification. It’s all observational so we shouldn’t overinterpret it, but the pattern seems worth sharing.
As I said in the original post, this is yet another ecological study, which shows correlation but not necessarily causation. Still, there are a lot of ecological studies from all over the world, with more coming on a regular basis, and they all show the same thing. So it’s reassuring that this particular study passes the Gelman test. The relationship between childhood lead poisoning and violent crime is getting stronger all the time.


