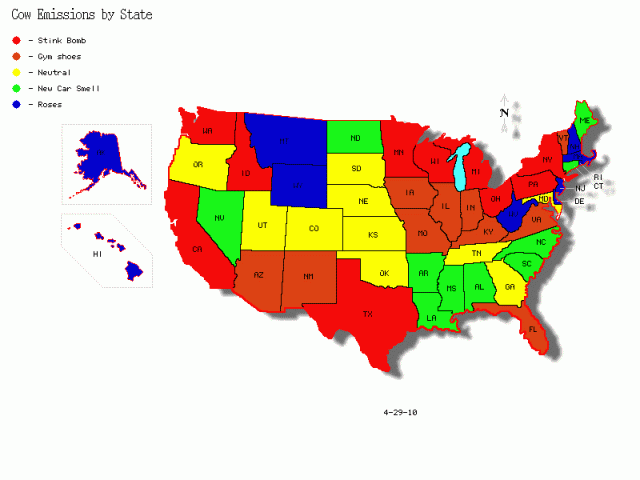
The EPA has spent nearly $15 million and two years studying bovine emissions to assess how they affect climate change. So what’s the result? This handy “fart chart” shows you exactly how much crap cows are putting into the air. Although the EPA’s original chart, here, only gives you the top 10, we’ve crunched the rest of the data so you can see exactly how flatulent your state’s cows are. Top 10 below, full list after the jump.
1. California 2. Wisonsin 3. New York 4. Pennsylvania 5. Minnesota 6. Idaho 7. Texas 8. Michigan 9. Ohio 10. Washington

- California
- Wisconsin
- New York
- Pennsylvania
- Minnesota
- Idaho
- Texas
- Michigan
- Ohio
- Washington
- Iowa
- New Mexico
- Vermont
- Missouri
- Indiana
- Florida
- Illinois
- Virginia
- Arizona
- Kentucky
- Kansas
- Oregon
- Utah
- Tennessee
- Colorado
- South Dakota
- Georgia
- Maryland
- Oklahoma
- Nebraska
- North Carolina
- Louisiana
- North Dakota
- Maine
- Arkansas
- Mississippi
- Connecticut
- Nevada
- Alabama
- South Carolina
- Massachusetts
- Montana
- New Hampshire
- West Virginia
- New Jersey
- Delaware
- Hawaii
- Wyoming
- Rhode Island
- Alaska


