Record extreme temperatures for 1-23 February 2012: WundergoundWundergound has launched a cool new tool today called Record Extremes that lets you see and sort US and international records for temperature, rainfall, and snowfall set on a map and a table.
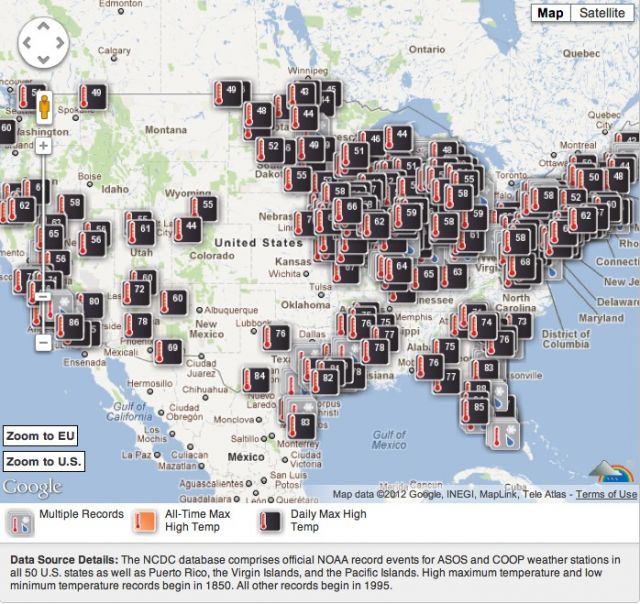
The image above is one I generated for the month of February (so far: 1-23 Feb 2012), looking at daily-maximum-high-temp records and all-time-max-high-temp records for the lower 48. It returned 450 record highs plotted on the map, plus a list of each record in a table format (not shown).
The site is a lot more interactive than this screen save. You can click on each record on the map and see its stats, then zoom in for a closer look.
Many of the icons on the map above are actually bundles of several records in close proximity. As you can see, it’s been a record-breaking February in the US, with some places breaking multiple records (gray icons).
As for the data behind the tool, here’s what Angela Fritz at WunderBlog writes:
The product uses data from three sources: (1) NOAA’s National Climate Data Center [NCDC], (2) Wunderground’s US records, and (3) Wunderground’s International records. The NCDC records begin in 1850 and include official NOAA record extreme events for… weather stations in all 50 US states as well as Puerto Rico, the Virgin Islands, and the Pacific Islands. In this database you can find records for maximum high temps, minimum high temps, maximum low temps, minimum high temps, snow, and precipitation on daily, monthly, and all-time scales.


