Dollar bills: <a href="https://commons.wikimedia.org/w/index.php?curid=185802">Manuel Dohmen</a>/Wikimedia Commons
It’s no secret that the United States has a glaring—and growing—problem with inequality. The Great Recession made things worse, and the recent economic recovery remains uneven, and unevenly distributed. Families in the bottom 99 percent of households have recovered just 60 percent of their income losses from the economic slump, according to a recent analysis of tax data by University of California-Berkeley economist Emmanuel Saez.
Meanwhile, the superrich keep getting richer: The average family in the top 1 percent of earners makes 40 times more than the average family in the bottom 90 percent of households. Families in the top 0.01 percent—the 1 percent of the 1 percent—make, on average, a whopping 198 times more than those in the bottom 90 percent, according to Saez and fellow economist Thomas Piketty’s data.
It’s no wonder, then, that despite millions of jobs being added under President Barack Obama and an economy that looks good on paper, many voters who felt left out of the recovery turned out for Donald Trump. “An economy that fails to deliver growth for half of its people for an entire generation is bound to generate discontent with the status quo and a rejection of establishment politics,” Saez, Piketty, and fellow economist Gabriel Zucman recently wrote in a post for the Washington Center for Equitable Growth. Trump tapped into that discontent—now we’ll see if he and his billionaire-packed Cabinet can recover those decades of lost prosperity for most Americans.
Here’s a closer look at the current state of income and wealth inequality:
The middle class is still struggling
First, some good news: Last year, middle-class households reaped an income gain of 5.2 percent, the highest level since 2007. Now the bad news: Despite such overdue gains, average American households are barely making more than they did in 1980. Median household incomes have risen just 17 percent (in real dollars) during the past 35 years, lagging far behind GDP growth. Meanwhile, the corporate profits and the average income of the top 1 percent of earners has skyrocketed.
The superrich are still thriving
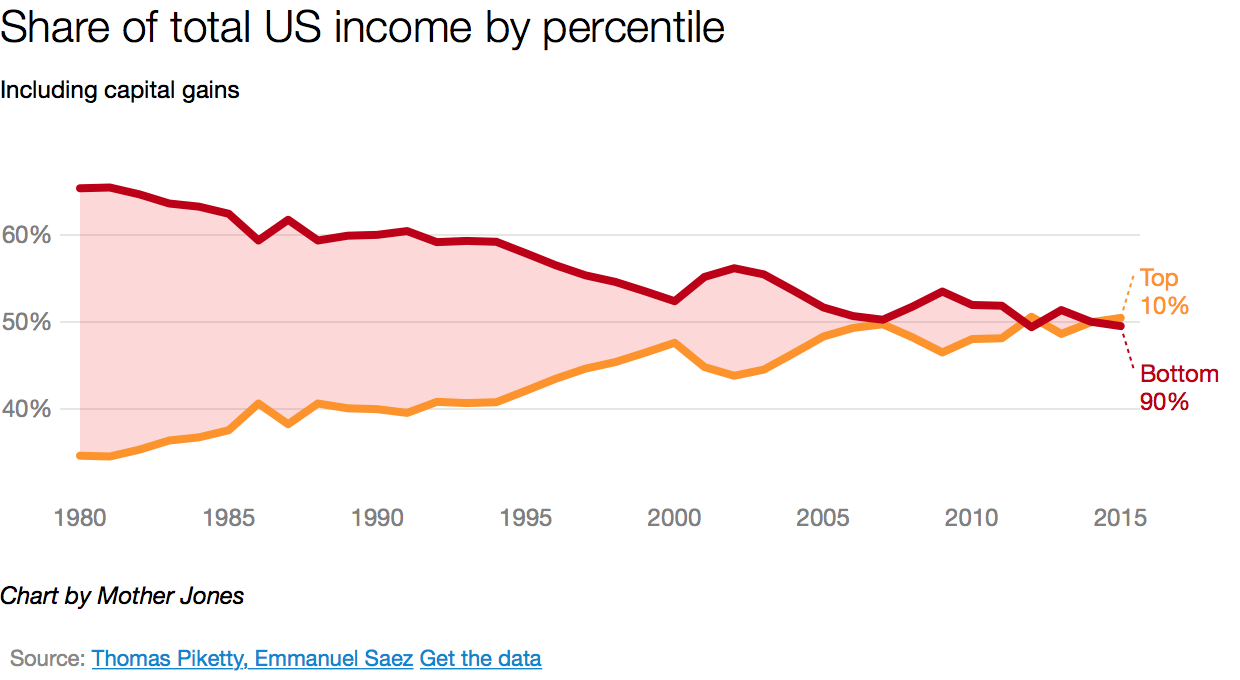
The average income for the top 0.01 percent of households grew an astounding 322 percent, to $6.7 million, between 1980 and 2015. Despite seeing 3.9 percent growth in the last year, the highest rate since 1998, the average income of the bottom 90 percent has effectively flatlined, increasing just 0.03 percent since 1980.
Half of all income goes to the top
As of 2015, half of all US income was going to the top 10 percent of earners. Piketty, an economist at the Paris School of Economics, predicts that if the current trend holds, their share will eventually reach 60 percent.

Most post-recession gains went to the top
Like millions of Americans, top earners took a hit during the Great Recession. But when the slump officially ended, they bounced back much faster and further than most. In fact, more than half of all income gain during the six years following the downturn went to the top 1 percent.
Minimum wage can’t keep up
The situation for workers earning minimum wage remains bleak. In real dollars, the current federal minimum wage is worth 26 percent less than it was in 1970. Compare that to the increase in top incomes (like those of Trump’s pick for labor secretary, fast-food CEO Andy Puzder, a staunch opponent of minimum-wage hikes).
It’s not just about income, but wealth
The richest households have not only seen an upsurge in incomes, but also an accumulation of wealth in the form of property and assets. The recession tanked many Americans’ net worth: The median household net worth dropped 45 percent between 2007 and 2010.
More wealth is trickling up
Here, too, the superrich are capturing the lion’s share of gains. Since 1983, the 1 percent’s share of total net worth has jumped to 37 percent, while the share of net worth held by the bottom 90 percent has slumped to 23 percent. “Income inequality has a snowballing effect on wealth distribution,” Saez and Zucman wrote in a May paper in the Quarterly Journal of Economics. “[T]his snowballing effect has been sufficiently powerful to dramatically affect the shape of the US wealth distribution over the last 30 years.”
Race and inequality are linked
Not all families benefited equally from the economic recovery. The median wealth of white households remains 13 times more than that of black households and 10 times more than Latino households’.
Education also matters
Education levels also affect income disparities. David Autor, an economist at the Massachusetts Institute of Technology, found that between 1979 and 2012, the gap in median earnings between high school-educated and college-educated households grew by $28,000. If these households benefited from the same income gain as the top 1 percent, they would have seen an increase of $7,000 each.
Location, location, location
Economic inequality also isn’t distributed evenly geographically. Children growing up poor in Baltimore, Maryland, will make 17 percent less than the average low-income American by the time they becomes 26. But children family who live just 46 miles west in Montgomery County could earn 10 percent more than average low-income adults.
Upward mobility is slipping
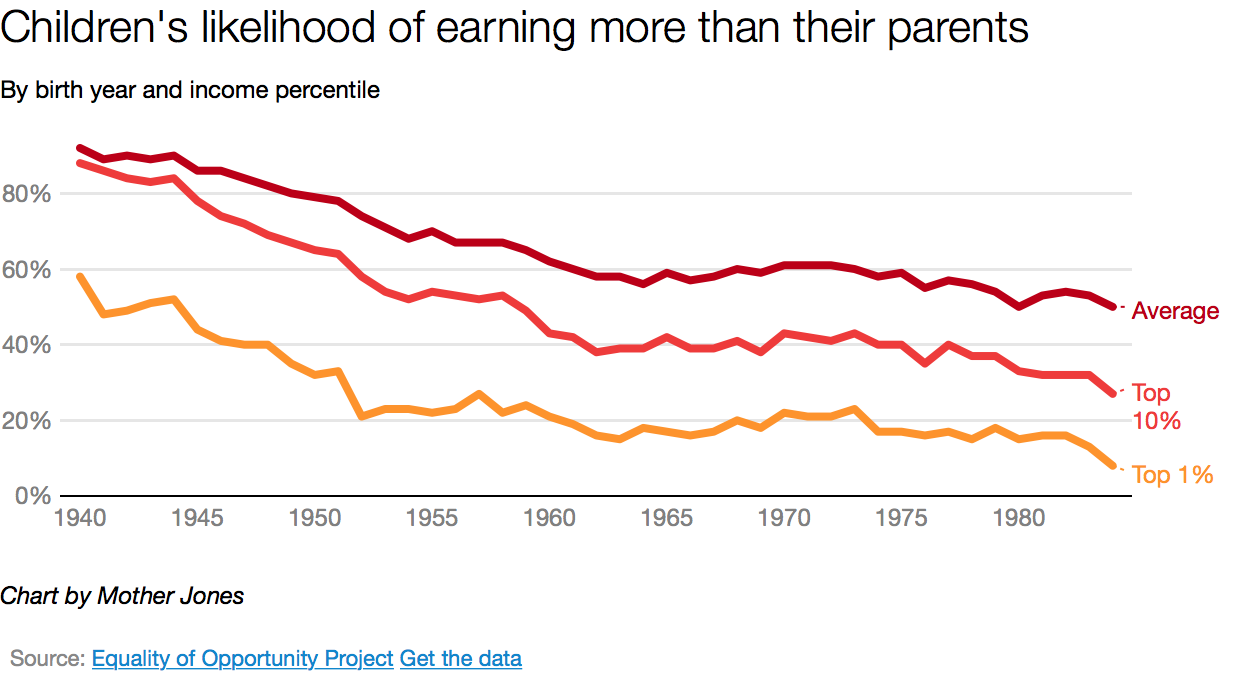
For decades, Americans have assumed they might be more prosperous than their parents. But that dream of upward mobility is becoming harder to realize. As research from the Equality of Opportunity Project shows, a child born in 1980 is half as likely to make more money than their parents by the time they reach adulthood, while a person born in 1940 had a 92 percent chance of doing so. And as more income has become concentrated at the very top, even children born into wealthy homes are seeing their prospects decline.


